| country | gdp_per_capita | life_expectancy | education_expenditure_gdp_share | |
|---|---|---|---|---|
| 0 | Zimbabwe | 2040.546587 | 62.360000 | NaN |
| 1 | Zambia | 1447.123101 | 65.279000 | 3.658841 |
| 2 | Yemen, Rep. | NaN | 67.952000 | NaN |
| 3 | West Bank and Gaza | 3799.955270 | 76.662000 | NaN |
| 4 | Virgin Islands (U.S.) | 44320.909186 | 80.319512 | NaN |
World Development Indicators 2022
2025-10-08
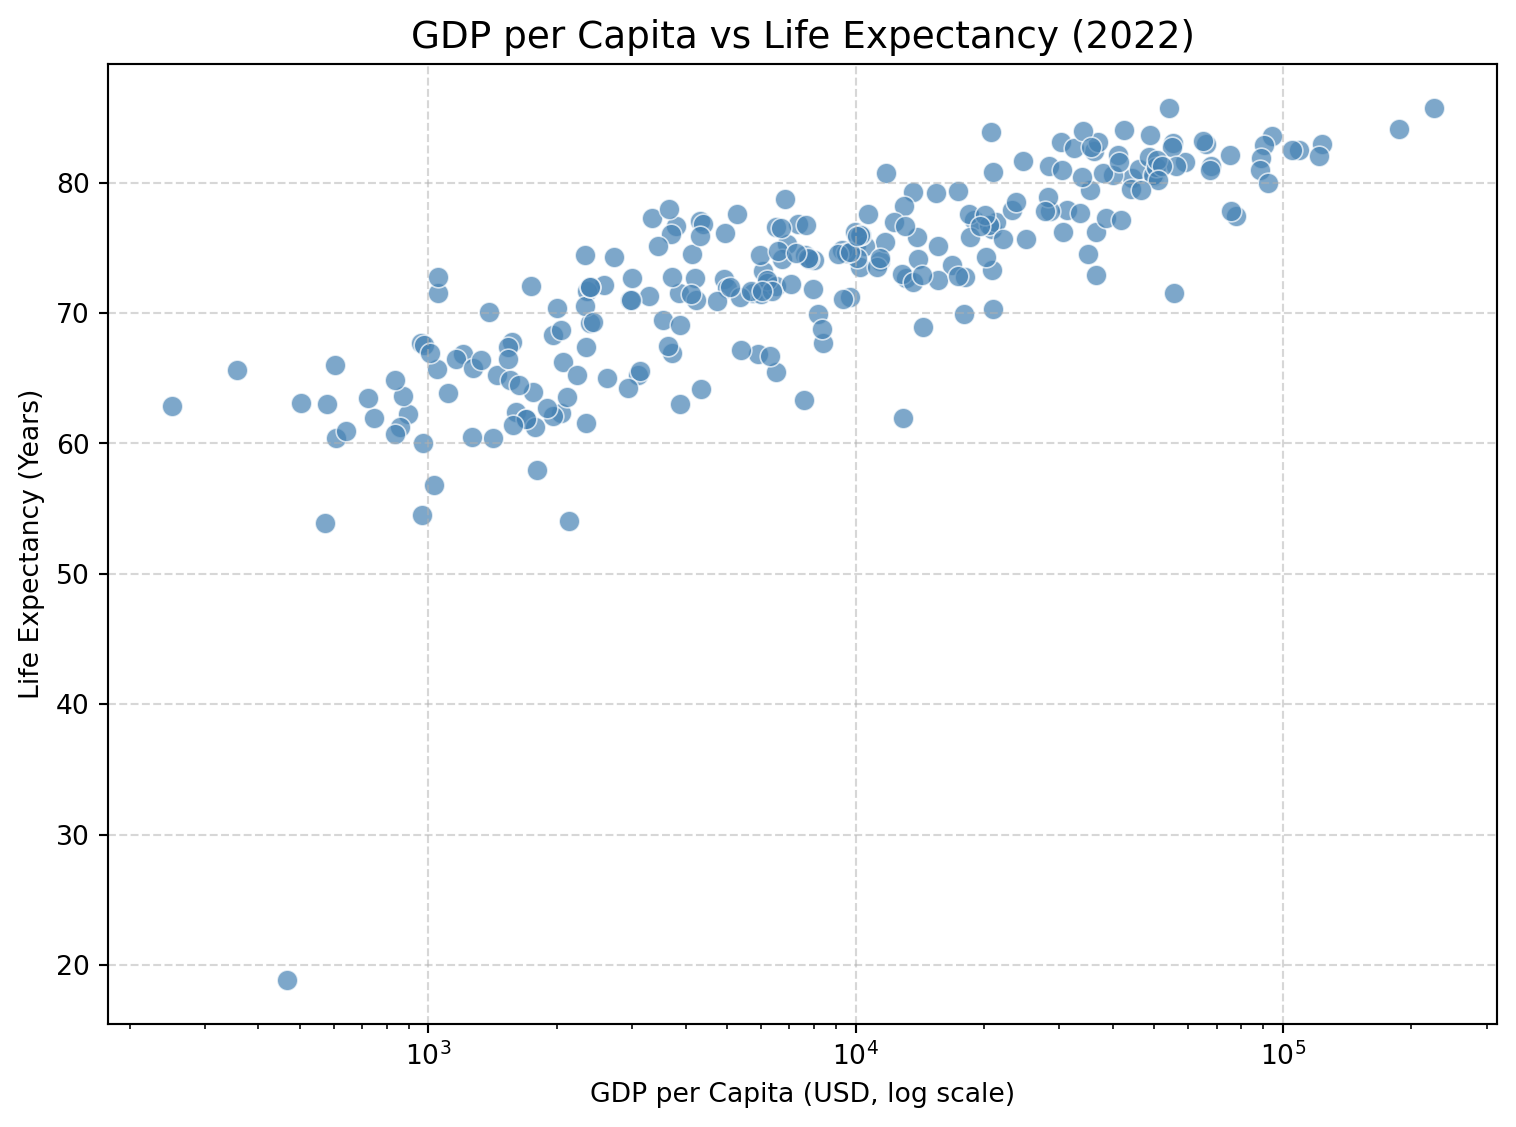
GDP per Capita vs Life Expectancy
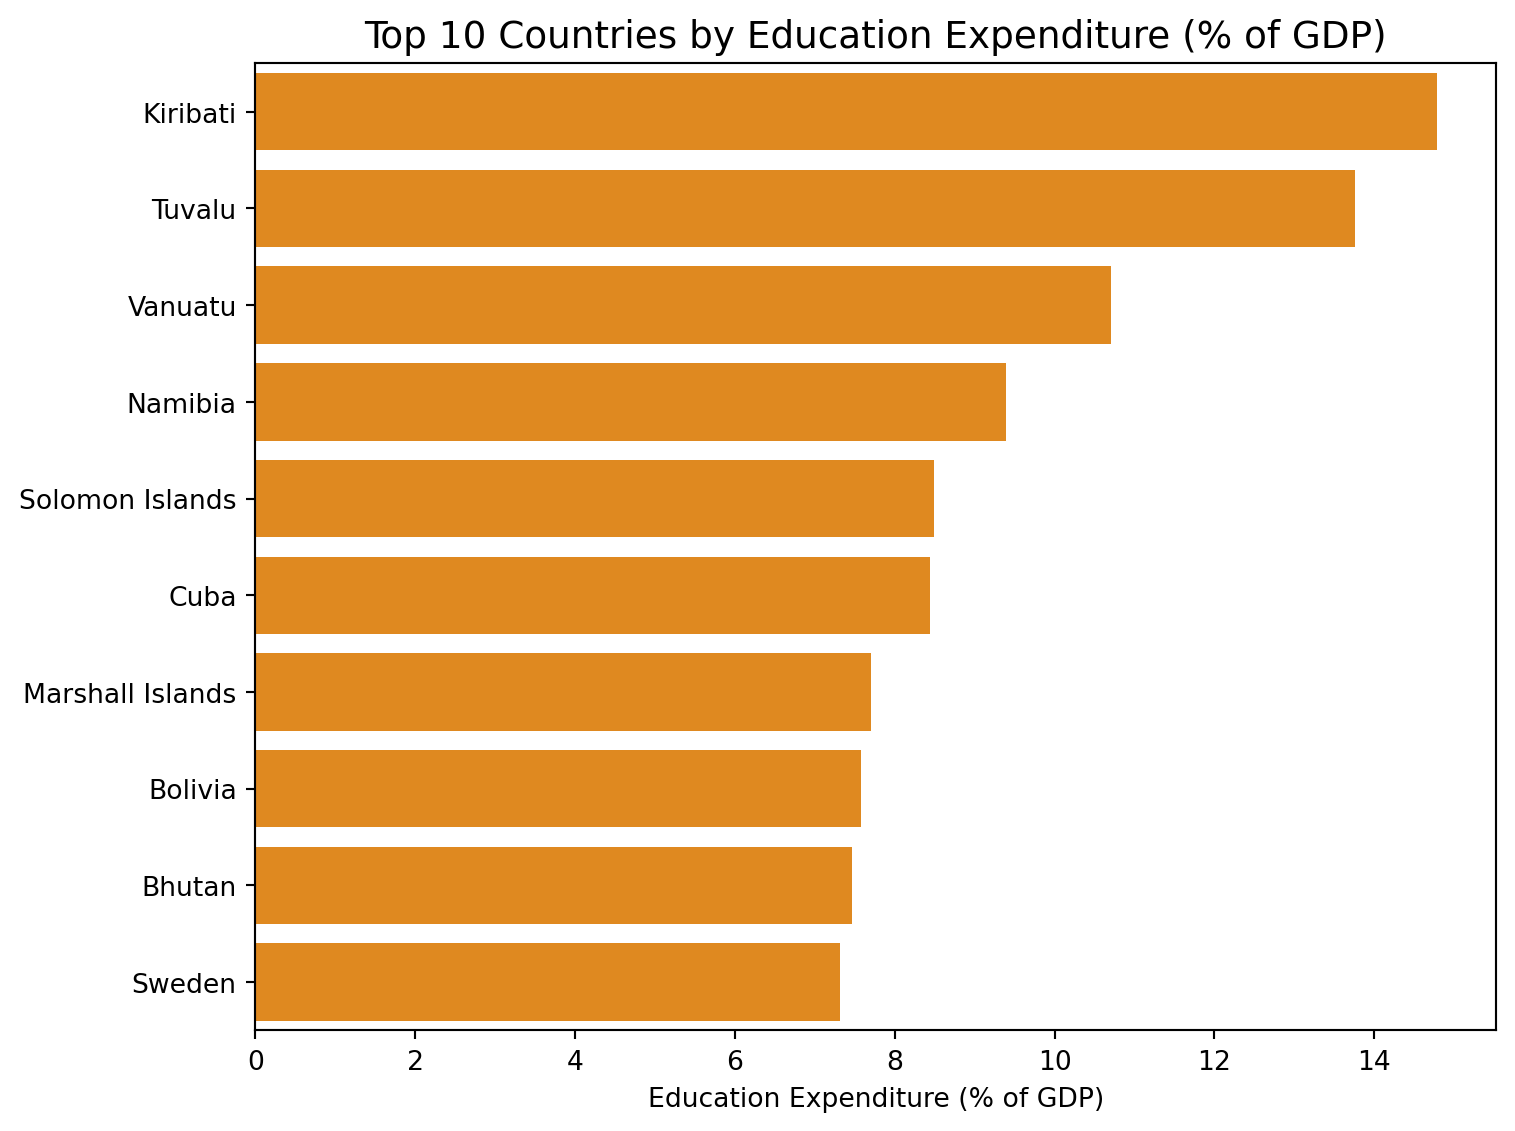
Top 10 Countries by Education Expenditure